WinOLS tuning software user guide
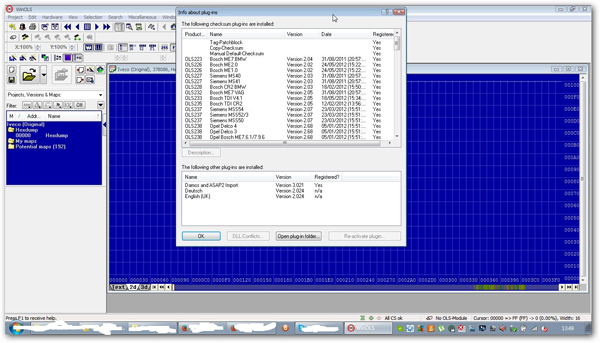
Part 1 :Winols 2.24 one-click installer download FREE
Part 2 :This guide is just the basics for beginners.
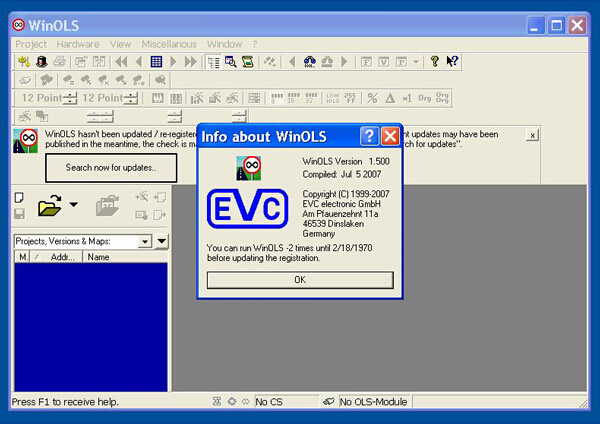
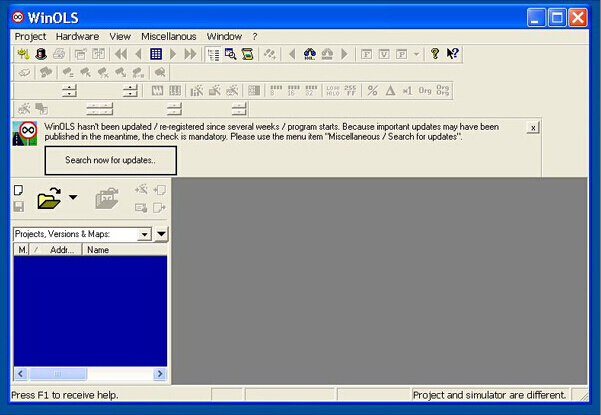
Starting with WINOLS cracked
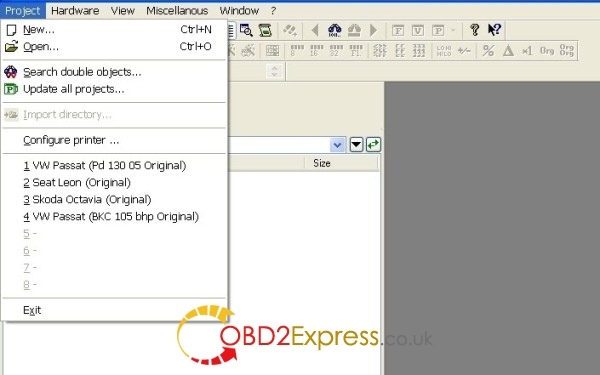
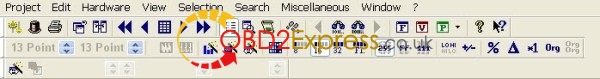
The first Winols screen looks like this.
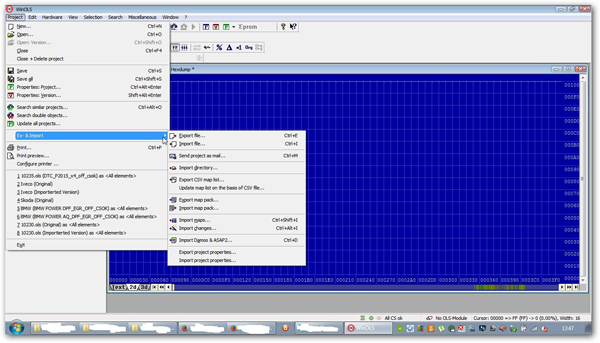
Click on Project to open the drop down menu shown below.
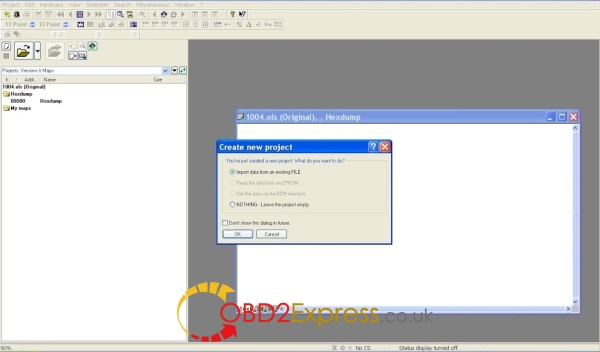
A new window and a pop up will appear. Click Ok to create your new project.
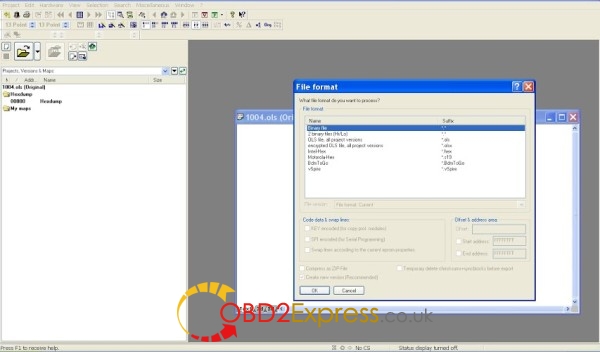
A new pop up will ask what format your project will be in..
You need to choose the format that suits your stored file.
If you have a single file, you probably want the first one (Binary)
If your file looks like two files, you want the second one. (Two binary files eg HiLow.)
The next screen will be the standard windows screen for opening any file on a computer. Navigate to where-ever you have your saved file and click open.
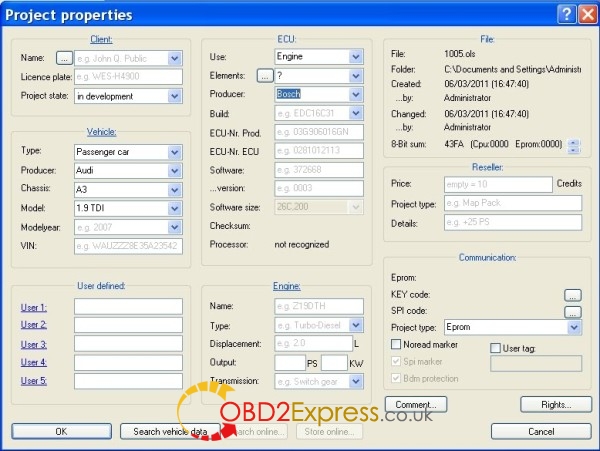
A new screen will appear asking you to give details of the file.
Winols will have automatically entered any data it has gained from the file.
Check that it has identified the ECU producer. E.g Bosch and also the ECU build, if possible.
Click “OK”.
After a few seconds your file name will appear in the left hand window.
This will be followed by “Hexdump” , “My maps” and “Potential maps”
If you click on Potential maps, a list of Auto discovered maps will appear.
The actual hexdump will appear in the large right hand window.
Any auto discovered maps will have an outline drawn round them along with a name and two numbers. Eg. 8 x 10.
You will NOT see any YELLOW highlights like in this picture.
How to find EGR in Winols full version:
At this point it is worth checking the Winols set up.
Winols should have automatically set some parameters for you according to the opened file.
If you imported a 16 bit file, 16 bit button will be highlighted on the toolbar.
If the hexdump opened in hexadecimal (FFFF, 1C2A etc) the FF button will be highlighted.
If you prefer counting in Tens, click the 255 button to highlight it and get a hexdump like the one shown above.
Check the format that the hexdump was assembled in. (HILO or LOHI) You can see this on the button under the green “P” button.
The example below shows LOHI.
Don’t forget this 16 bit and 255 detail.. It may trip you up later if you don’t watch out for it. (See Map properties pop up)
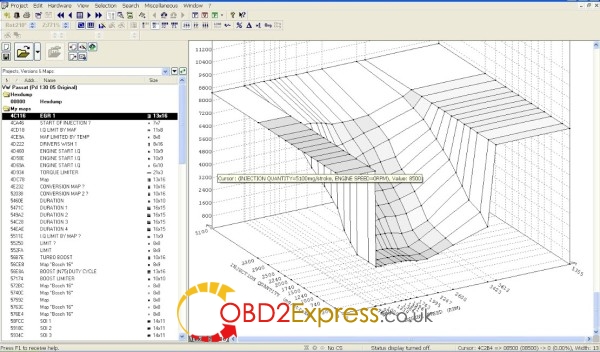
You can now click on any auto discovered potential map in the left hand window.
A 3D image of the potential map will open. It will be in a new pop up window.
This has been resized to fill the whole right hand window in the picture below.
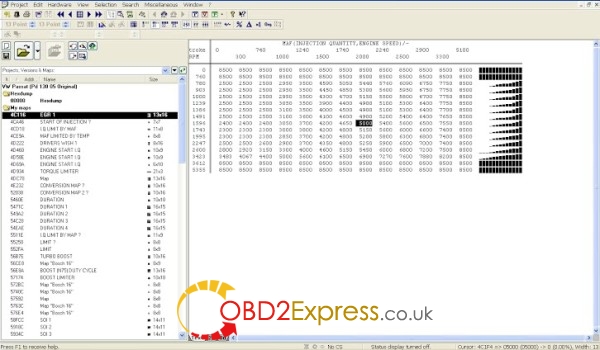
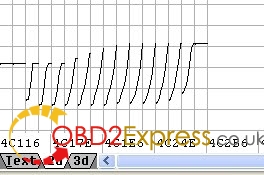
At the bottom of the picture you will see: Text, 2D & 3D.
If you click Text, the image will change to text as shown below.
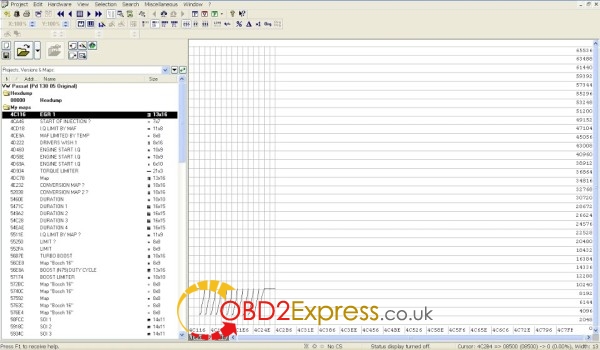
If you click 2D, the image will change to a line graph as shown below.
As a beginner it is easier to identify any obvious 3D maps and so you may want to stick with the 3D view until you learn to recognise a few maps.
If you close a map (Red X) you will be asked if you want to add the map to “Your maps”. If it’s one you want to keep, Name it and click Yes.
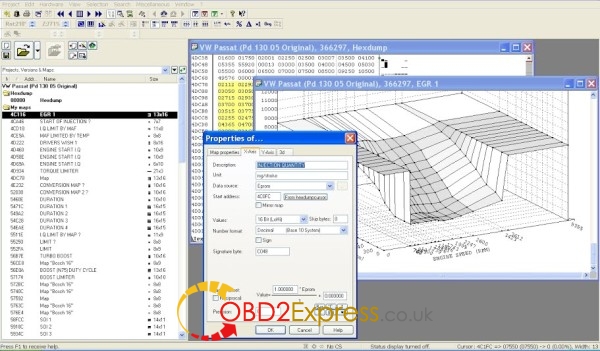
To name your map. Double click the map to open the “Properties” pop up.
You will see a box called “Name”.
It probably has a name like Bosch 16 bit. 8 x 10. Change this to a name that suits you.
The rest of the properties for the map depend on how good you are at recognising the map.
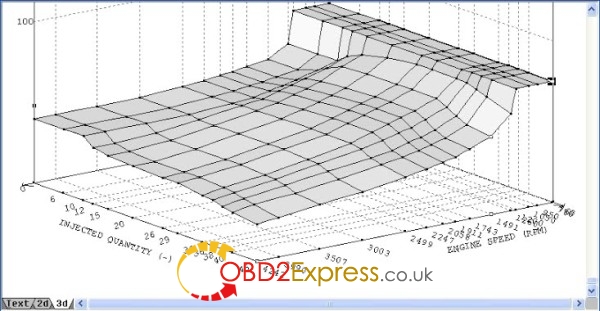
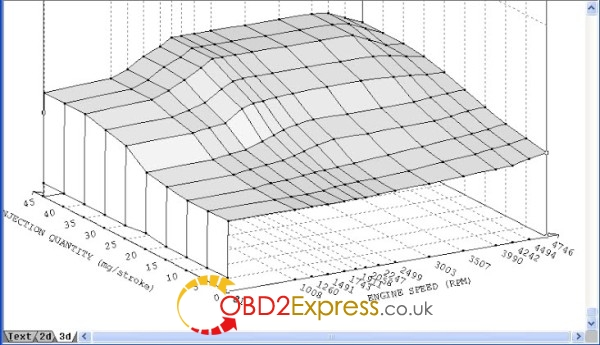
The one shown in these pictures is the Mass Air Flow map. Often called EGR map.
If you are familiar with “2D graphs, the 3D map may be a bit confusing.
Winols doesn’t highlight the X and Y axes in the hexdump. It highlights the Z axis figures.
This can be confusing because the 3D map will always contain the highlighted Z axis numbers but the X and Y axis numbers can be missing.
When this happens, winols uses 1, 2, 3, 4 etc on the axes for X and Y.
Even if the X and Y axes are correctly numbered, it is likely that they will not make any sense when you first see them.
With luck, Winols has automatically entered numbers onto the axes.
These should be FIVE digit numbers. Eg. 12345.
This poses a new problem.
12345 could 1,2345 rpm for engine speed.
12345 could be 12.345 % for duty cycle.
12345 could be 12.345 grams per stroke for mass air flow.
12345 could be 12.345 grams per stroke for fuel Injected Quantity.
12345 could be 12.345 degrees of Crankshaft Rotation for injection Duration or injection Advance.
If the map is a well known one, you may recognise it and be able to look up what the axes should be.
E.g.
The EGR map will be.
X axis: Injection Quantity in milligrams per stroke.
Y axis: Engine speed in RPM
Z axis: Mass Air Flow in milligrams per stroke.
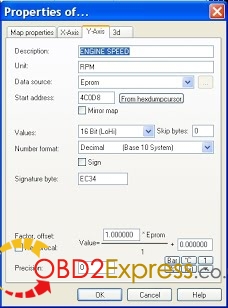
The first “map properties” page (shown in the picture above) is for title and Z axis so the Z axis details go here.
You can see that I have entered
Description: INJECTION QUANTITY
Unit: mg/stroke
Data source, start address, values, number format, signature byte etc are usually automatically entered by Winols.
This is where auto entry can trip you up…..see later comments.
At this point the mg/stroke values on your Z axis are still based on FIVE digit numbers like; 10000, 11000 etc
The mg/stroke scale should read mainly “hundreds” so 9000 on the Z axis is actually 900 mg/stroke. NOT 9000.
I haven’t bothered to correct this in the picture below so it reads 8000, 9000, 10000 etc.
To correct this. Go to the “Factor” box which reads 1.00000 and change the value to 0.1.
This will change 8000, 9000, 10,000 into 800, 900, 1000 etc.
Don’t touch the “offset” box. You will need to change that for some values, but not this one.
So now you can go through the “Properties” pop up and fill in the details for Map properties, Z axis and name.
Check to make sure that the Values box is the same as the main toolbar setting.. “16 bit LOHI” in this example
Check the Number format box is the same as the main toolbar setting. “Decimal (Base 10 system)” in this example
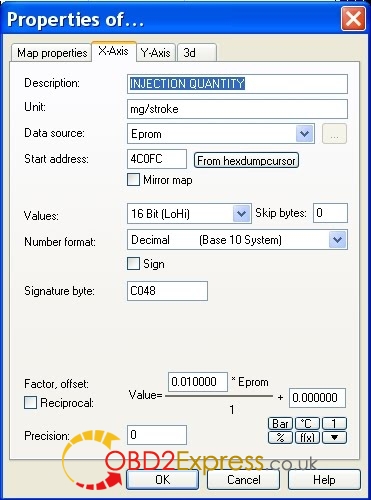
Then complete the X – axis details as below.
Again I haven’t bothered to change the factor for mg/stroke. It should read 3, 4, 5, 6 etc not 300, 400, 500. So you might want to change the factor to 0.01.
Then the Y axis details as below. (Factor can stay as 1.0)
If your map looks exactly how you expect in terms of shape, axes labels, axes scales then you have finished one map.
Click OK.
Sometimes when you click ok the map becomes a complete mess. Don’t panic. It means something is wrong in one or more of the properties.
Just open the properties popup and search for your mistake.
How to find MAPS in Winols manually:.
Anyone using Winols software will tell you not to rely on the automatic map search. You will never learn about Winols and maps if you try to rely on the automatic search.
Winols cannot identify all maps automatically. It often finds some good obvious ones, some useless ones and some that are not maps at all.
For this reason it is a good idea to learn to search for them your self.
Open Winols as usual and open your project.
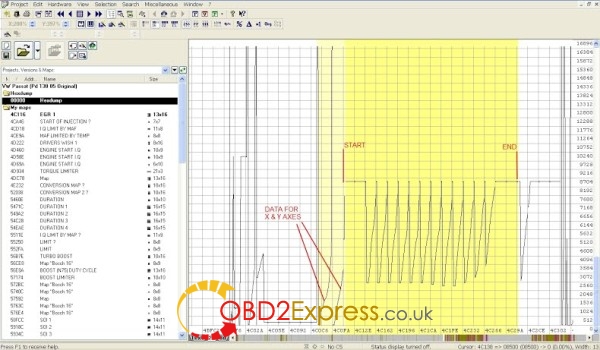
Change the hexdump view to 2D.
Use the direction arrows to scroll through the 2D file.
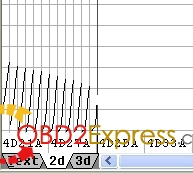
You are looking for a potential map like the one highlighted in YELLOW below. It won’t be highllighted in yellow….life isn’t that simple.
Take your best guess at the beginning and end of the map. This one has a wide bar at each end.
Using your keyboard, hold down Ctrl key and press left or right direction key. You will see the grid behind the trace, move.
Move the grid until a vertical line, lines up with any trace point.
You can line the grid up with the start of the trace, at the point (top), or at the end of the trace. It doesn’t matter.
The object of this game is to get a vertical line to line up with each trace point, just like on the picture above.
Press “w” to move the grid lines closer together.
Press “m” to move the grid lines further apart.
Every time you use “w” or “m”. remember to move the grid to keep your original vertical line in the same place.
Eventually you will find a point where each trace point has a grid line matched with it.
What you are trying to do is produce a set number of columns. In the picture above you can see 16 columns.
(Ignore the two faint yellow ones on the left).
Use the mouse to click on the left side start of your map and drag across to the right side end of your map.
The map will be selected as grey and white stripes.
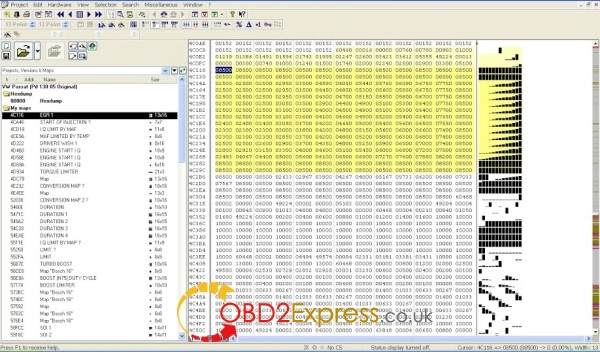
Now switch to Text view.
If everything has worked perfectly it will look like the picture below. Instead of being YELLOW, the highlighted bit will be GREY.
Now go to the top taskbar and select Window > Preview. A new window will open showing your selected map.
If nothing happens, your selection is no good or Winols is playing up (It does that).
You can leave the Preview window open all the time if you want. OR just call it up when you want to look.
If the preview, looks like a map, click anywhere on the selected area.
Press “k” on the keyboard and this will turn your selection into a map.
The map will appear in a new window in text form with the usual text/2D/3D options.
If you change to 3D view it will look like the “preview” window.
Click the RED X on the box and it will automatically be saved in the “My maps” section in the left window.
Sometimes when you change from the 2D view to the text view you don’t get a perfect rectangle block of text. If this happens, something is wrong with your selection.
You just play the same game again in text view.
“m” key will give you more columns and “w” key will give you less columns.
Ctrl left arrow and Ctrl right arrow will move your selection on the grid.
A good tip is to look at the numbers in each row. Look for any kind of pattern. In the selection above you can see that the top and bottom row cells are all 08500. So it is obvious when you have the selection lined up properly.
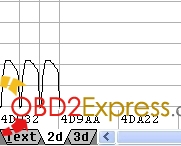
Here are some typical 2D map shapes to help you search in 2D.
EGR
DRIVERS WISH
TORQUE
N75 DUTY CYCLE
TURBO BOOST
BOOST LIMIT
Lots of the other maps just look like flat lines in a 2D view unless you zoom the view. That makes Duration and Start of Injection etc, harder to find.
How to find Single Value Boost Limit (SVBL):
In some Hexdumps, this is found just before the Hexdump address 32043 or 31455.
To find it click “Search” on the toolbar followed by byte sequence/text. Set the data tab to decimal and type in the address. E.g. 32043.
Press Right Arrow. You will either get sent to the correct address or get a message saying “not found”. If the address is found, the SVBL should be the box in front of 32043. A typical VW turbo figure is 2350 so it will read 02350.
If 32043 doesn’t work, try 31455.
If neither 31455 or 32043 work, you will have to search in 2D mode.
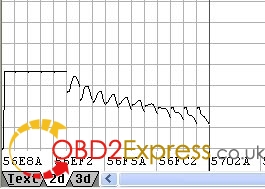
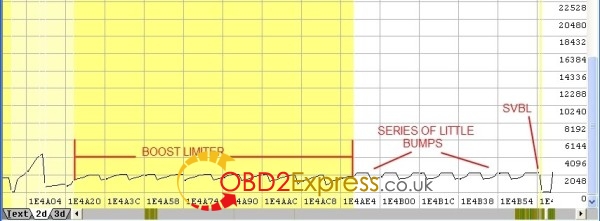
First use the Hexdump to find your boost limiter map.
e.g.
Find the end of the Boost limiter map. (It’s easier to find the end in TEXT view). This will be followed by a series of little bumps as shown above.
The highest point of the last little bump is the SVBL. In the example above, the little bumps are all 2250 but the last one is 2350. That is the limiter.
If none of these methods work, you may have to ask on a chip tuning forum.
My AXES are MISSING, how to do:
Winols automatically finds map axes data when the data is in an obvious place. E.g. just before or just after a map.
So when you manually find a map, you may be lucky and Winols will spot the axes data and enter it for you.
If Winols can’t find the map axes data it simply uses 1, 2, 3, 4, 5 etc for the axes.
This means you will have to find the map axes data and tell Winols where the data is.
How to find map axis data and add it to WINOLS tuning software:
Lets assume you are looking at a 3D map with X and Y axes that both say 1, 2, 3, 4, 5, etc.
You need to switch back to the hexdump which will have the map highlighted in grey or yellow.
Count the number of columns and rows.
EGR 1 in the picture above is 13 columns by 16 rows and is shown in the left hand window as 13 x 16.
This information is hiding in the hexdump. 13 will be 00013 and 16 will be 00016.
Sometimes the numbers 00013 and 00016 will be next to each other and sometime not.
The main clue is the number of cells.
E.g.
|
|
|
|
|
|
|
60468
|
49224
|
00016
|
00013
|
00000
|
00700
|
00800
|
|
00840
|
01000
|
01239
|
01386
|
01491
|
01596
|
01743
|
01995
|
02247
|
20499
|
02750
|
03423
|
03612
|
|
00000
|
00300
|
00740
|
01000
|
01240
|
01500
|
01740
|
02000
|
02240
|
02500
|
02900
|
03300
|
05100
|
00016 and 00013 are followed by 16 cells from 00000 to 03612 and then 13 cells from 00000 to 05100.
Because 00016 and 00013 are next to each other they are easier to spot.
It is harder when the Axes pointers are not next to each other. E.g.
|
|
|
|
|
|
|
60468
|
00016
|
00000
|
00700
|
00800
|
00840
|
01000
|
|
01239
|
01386
|
01491
|
01596
|
01743
|
01995
|
02247
|
20499
|
02750
|
03423
|
03612
|
49224
|
00013
|
|
00000
|
00300
|
00740
|
01000
|
01240
|
01500
|
01740
|
02000
|
02240
|
02500
|
02900
|
03300
|
05100
|
00016 is followed by 16 gradually increasing numbers from 00000 to 03612. The next cell is 49224 which obviously doesn’t follow the previous pattern.
00013 is followed by 13 gradually increasing numbers from 00000 to 05100.
Because 00016 and 00013 are not next to each other, they are harder to find.
The section with 00016 and 00013 may be before or after the map you are looking at.
Sometimes there may be 10 similar maps, all with the same axes. (Start of Injection maps are grouped like this.)
The axes data may be well before the first map or well after the last map so don’t just look next to the maps.
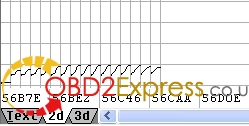
Surprisingly, a good clue is in the 2D view. The axes data will often look like Two spikes well before or well after the map data block.
How to add the axes data to WINOLS full version:
On the “hexdump”, Click on the first cell for the axis data you want. E.g. 00000 after 00016 in the table above. You must do this so Winols can find the cursor.
Double click the 3D map to get the Properties box.
Choose “Y axis” tab.
Data source will currently display 1, 2, 3, 4, 5 etc. and start address will be “greyed out”.
Click data source and change to “Eprom”
Start address will be “zero”
Click “From hexdumpcurser”
Set “Values” to what ever is on the main “Map properties” page. (E.g. 16 bit HILO)
Click “ok”.
Go back to the hexdump.
Click on the first cell for the axis data you want. E.g. 00000 after 00013 in the table above.
Double click the 3D map to get the Properties box.
Choose “X axis” tab.
Data source will currently display 1, 2, 3, 4, 5 etc. and start address will be “greyed out”.
Click data source and change to “Eprom”
Start address will be “zero”
Click “From hexdumpcurser”
Set “Values” to what ever is on the main “Map properties” page.
Click “ok”.
Now your map should have the correct axis numbers displayed for X and Y.
You will still need to change “Description”, “Unit” and “Factor” if you haven’t done it yet.
How to understand FACTOR and OFFSET:
The factor just tells Winols where to put the decimal point in the numbers.
The numbers on the axes will be based on FIVE digit numbers. Eg. 12345 in 16 bit mode, decimal view.
But will often appear as FOUR digit numbers. E.g. 4000
You need to know what the axis data represents before you can work out the Factor and Offset.
E.g.
4000 may be 4000 rpm in which case the Factor can be left as 1.000000 and offset left as 0.000000
4000 may be 4000 mg/stroke in which case the factor might be 0.1 for Mass Air Flow at 400.0 mg/stroke
or the factor might be 0.01 for Injection Quantity at 40.00 mg/stroke.
Offset remains as 0.000000.
4000 may be % so again the Factor will be 0.01 and offset 0.000000.
4000 may be Temperature.
Scientists measure temperature in degrees Kelvin (°K) and so do ECU programmers.
If you read temperature in degrees Kelvin then you just need to set the Factor to 0.1 and 4000 becomes 400°K.
Most of us read temperature in degrees Celsius so we need a conversion “offset”
To convert from °K to °C you have to take away 273. So the offset is -273. and 400 becomes 400 – 273 which is 127°C.
You can often spot a temperature axis because it contains the numbers similar to 273, 263 and 253. These are 0°C, -10°C and -20°C.
One Factor that gives everyone a real headache is that for Degrees Crankshaft Rotation (°CR). This factor is used for Injection start
and injection duration.
One clue to Injection start and injection duration is that the numbers may be 3 digit (400) rather than 4 or 5 digit. (4000 or 40000)
This factor is 0.023437.
400 may be injection duration in °CR in which case the factor is 0.023437. So 400 will be 400 x 0.023437 which is 9.3748 °CR.
At this point things get more confusing. EDC15 ecu’s found on B5 passats measure Start Of Injection (SOI) as degrees After Top Dead Center. (°CR. ATDC) with a factor of 0.023437. This gives SOI figures on the map in the range 48 to 78 °CR. ATDC.
EDC16 ecu’s use the same factor (0.023437). The figures are Before Top Dead Center so the map range is 0 to 30 °CR. BTDC.
If you want the EDC15 figures to look more like EDC16 figures you use an offset of -78. This turns the 48 to 78 range into -30 to 0 range.
The figures are negative as they are ATDC. (Remember -30°CR. ATDC is the same as 30°CR. BTDC)
PRECISION.
To keep the axes tidy you might want to change 9.3748 to 9.3 or 9.37. You do this by changing the number in the precision box on the properties
Window. This just tells Winols how many numbers to show AFTER the decimal point.
So
1.234 with a precision of “0” is 1
1.234 with a precision of “2” is 1.23
etc
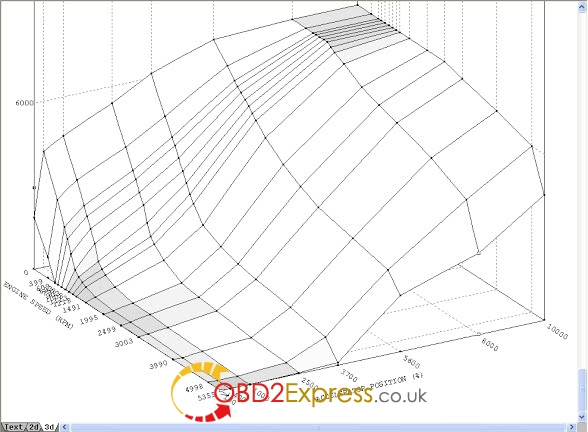
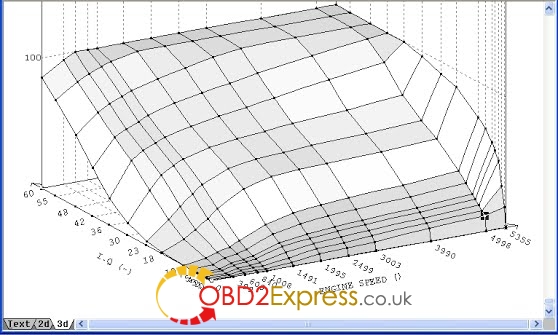
How to help with MAP IDENTIFICATION:
Here are some common 3D maps found in VAG PD tdi hexdumps.
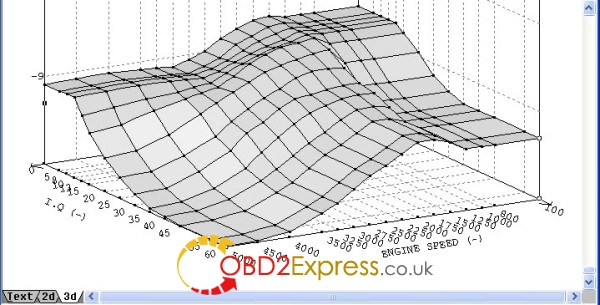
DRIVERS WISH.
INVERSE DRIVERS WISH
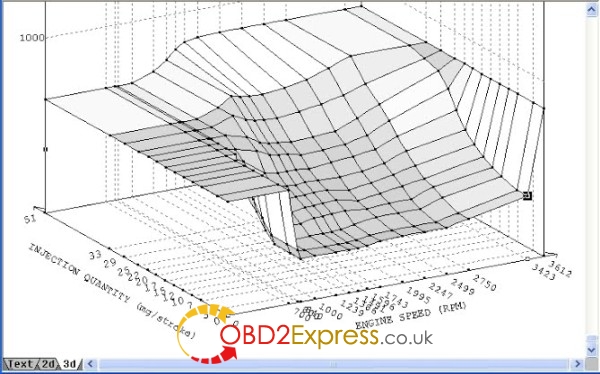
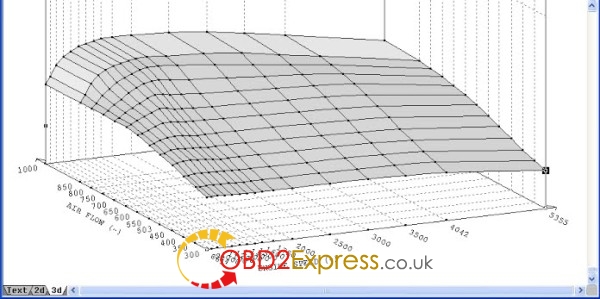
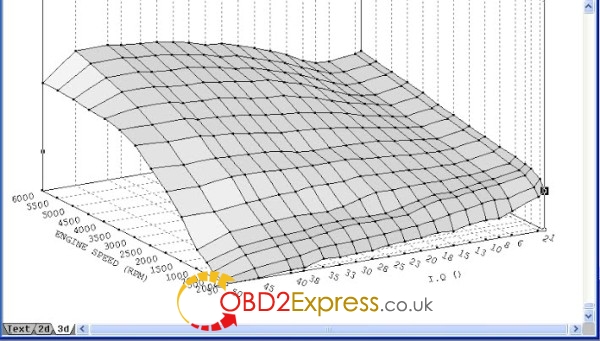
EGR
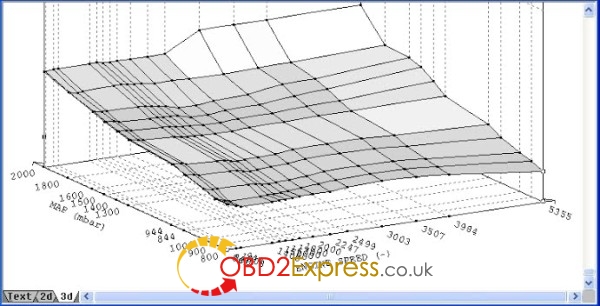
I.Q LIMITED BY MASS AIR FLOW. (SMOKE MAP)
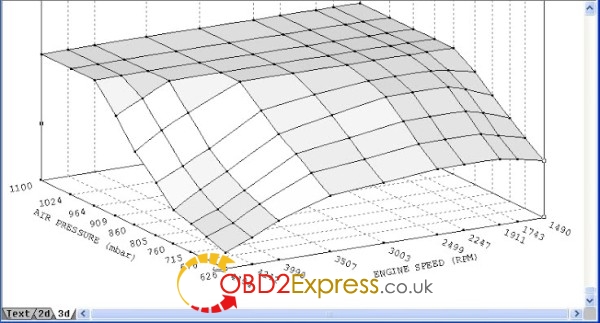
I.Q LIMITED BY MANIFOLD ABSOLUTE PRESSURE (SMOKE MAP)
TORQUE LIMIT
DURATION MAP
START OF INJECTION
BOOST DUTY CYCLE (N75) %
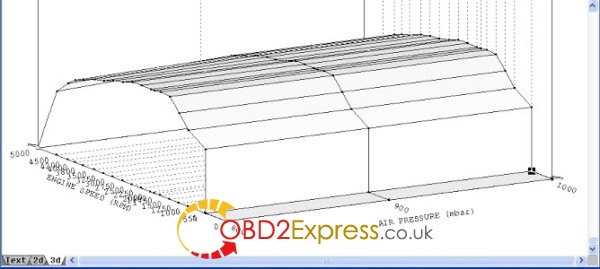
3BOOST MAP
BOOST LIMITER